Plasma Crash Course - DrKonqi
A while ago a colleague of mine asked about our crash infrastructure in Plasma and whether I could give some overview on it. This seems very useful to others as well, I thought. Here I am, telling you all about it!
Our crash infrastructure is comprised of a number of different components.
- KCrash: a KDE Framework performing crash interception and prepartion for handover to…
- coredumpd: a systemd component performing process core collection and handover to…
- DrKonqi: a GUI for crashes sending data to…
- Sentry: a web service and UI for tracing and presenting crashes for developers
We’ve already looked at KCrash and coredumpd. Now it is time to look at DrKonqi.

DrKonqi
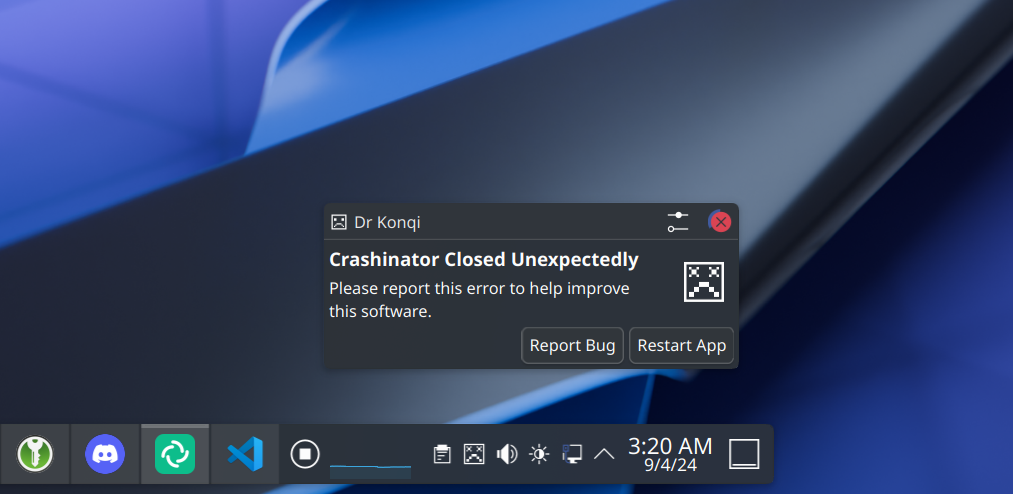
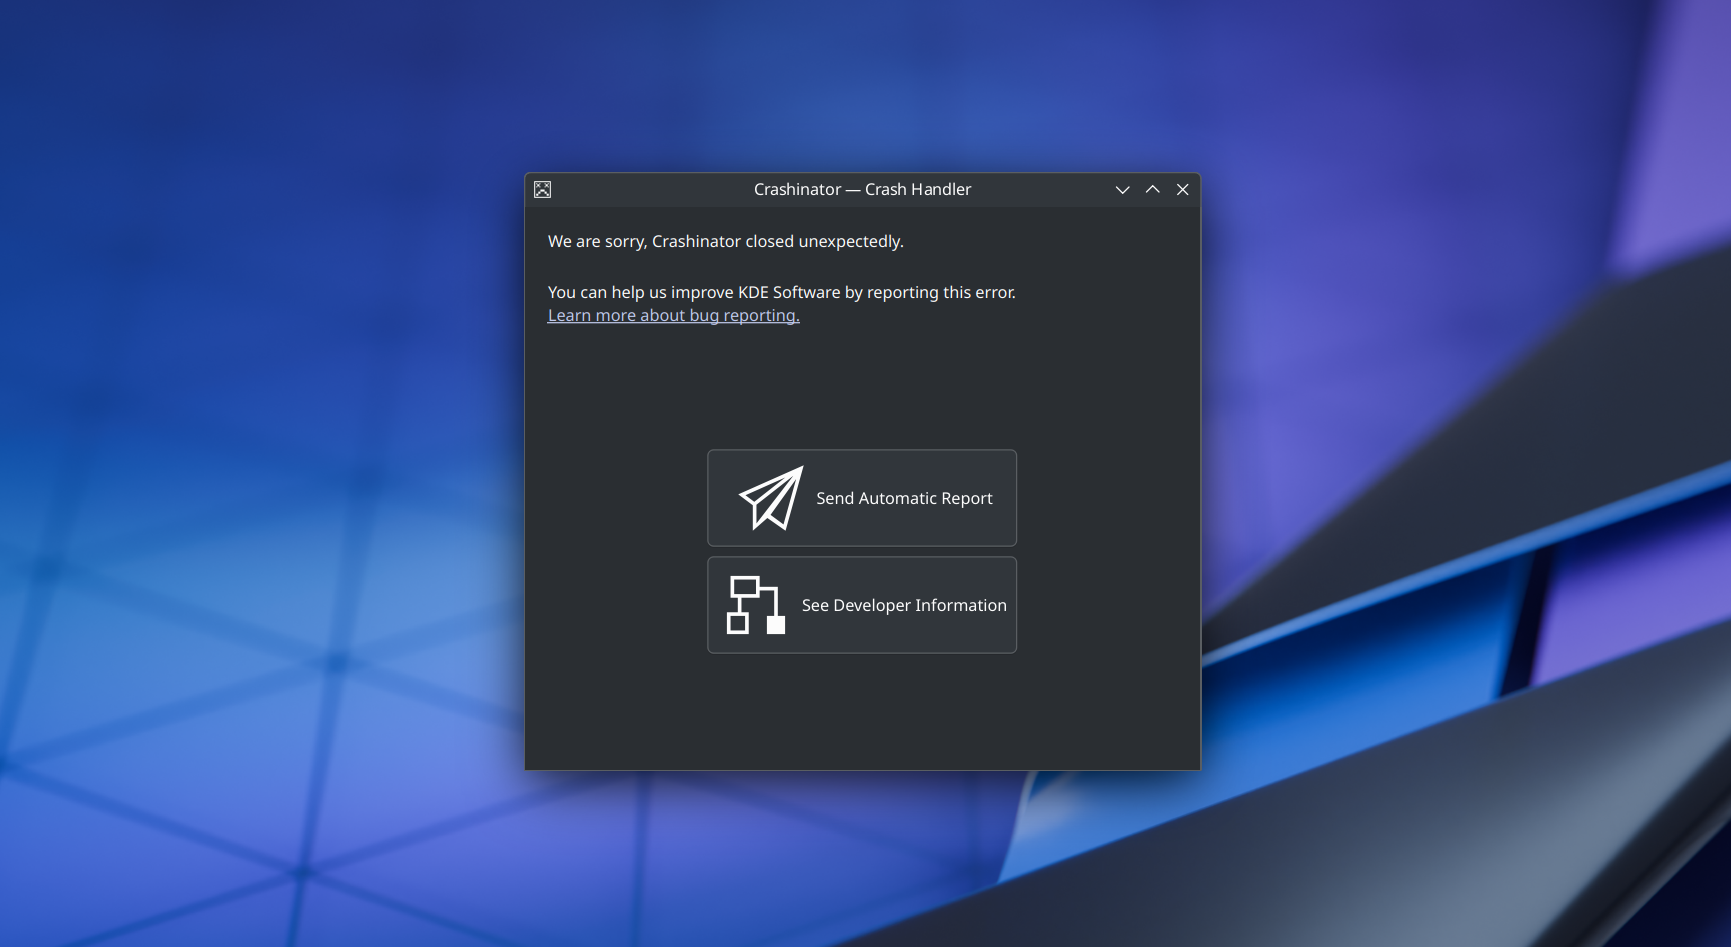
DrKonqi is the UI that comes up when a crash happens. We’ll explore how it integrates with coredumpd and Sentry.
Crash Pickup
When I outlined the functionality of coredumpd, I mentioned that it starts an instance of systemd-coredump@.service. This not only allows the core dumping itself to be controlled by systemd’s
resource control and configuration systems, but it also means other systemd units can tie into the crash handling as well.
That is precisely what we do in DrKonqi. It installs drkonqi-coredump-processor@.service which, among other things, contains the rule:
WantedBy=systemd-coredump@.service
…meaning systemd will not only start systemd-coredump@unique_identifier but also a corresponding drkonqi-coredump-processor@unique_identifier. This is similar to how services start as part of the system boot sequence: they all are “wanted by” or “want” some other service, and that is how systemd knows what to start and when (I am simplifying here 😉). Note that unique_identifier is actually a systemd feature called “instances” — one systemd unit can be instantiated multiple times this way.
drkonqi-coredump-processor
When drkonqi-coredump-processor@unique_identifier runs, it first has some synchronization to do.
As a brief recap from the coredumpd post: coredumpd’s crash collection ends with writing a journald entry that contains all collected data. DrKonqi needs this data, so we wait for it to appear in the journal.
Once the journal entry has arrived, we are good to go and will systemd-socket-activate a helper in the relevant user.
The way this works is a bit tricky: drkonqi-coredump-processor runs as root, but DrKonqi needs to be started as the user the crash happened to. To bridge this gap a new service drkonqi-coredump-launcher comes into play.
drkonqi-coredump-launcher
Every user session has a drkonqi-coredump-launcher.socket systemd unit running that provides a socket. This socket gets connected to by the processor (remember: it is root so it can talk to the user socket). When that happens, an instance of drkonqi-coredump-launcher@.service is started (as the user) and the processor starts streaming the data from journald to the launcher.
The crash has now traveled from the user, through the kernel, to system-level systemd services, and has finally arrived back in the actual user session.
Having been started by systemd and initially received the crash data from the processor, drkonqi-coredump-launcher
will now augment that data with the KCrash metadata originally saved to disk by KCrash.
Once the crash data is complete, the launcher only needs to find a way to “pick up” the crash. This will usually be DrKonqi, but technically other types of crash pickup are also supported. Most notably, developers can set the environment variable KDE_COREDUMP_NOTIFY=1 to receive system notifications about crashes with an easy way to open gdb for debugging. I’ve already written about this a while ago.
When ready, the launcher will start DrKonqi itself and pass over the complete metadata.
the crashed application
└── kernel
    └── systemd-coredumpd
        ├── systemd-coredumpd@unique_identifier.service
        └── drkonqi-coredump-processor@unique_identifier.service
            ├── drkonqi-coredump-launcher.socket
            └── drkonqi-coredump-launcher@unique_identifier.service
                └── drkonqi
What a journey!

Crash Processing
DrKonqi kicks off crash processing. This is hugely complicated and probably worth its own post. But let’s at least superficially explore what is going on.
The launcher has provided DrKonqi with a mountain of information so it can now utilize the CLI for systemd-coredump, called
coredumpctl, to access the core dump and attach an instance of the debugger GDB to it.
GDB runs as a two step automated process:
Preamble Step
As part of this automation, we run a service called the preamble: a Python program that interfaces with
the Python API of GDB.
Its most important functionality is to create a well-structured backtrace that can be converted to a
Sentry payload.
Sentry, for the most part, doesn’t ingest platform specific core dumps or crash reports, but instead relies on an abstract
payload format that is generated by so called Sentry SDKs. DrKonqi essentially acts as such an SDK for us.
Once the preamble is done, the payload is transferred into DrKonqi and the next step can continue.
Trace Step
After the preamble, DrKonqi executes an actual GDB trace (i.e. the literal backtrace command in gdb) to generate the developer output. This is also the trace that gets sent to KDE’s Bugzilla instance at bugs.kde.org if the user chooses to file a bug report. The reason this is separate from the already
created backtrace is mostly for historic reasons. The trace is then routed through a text parser to figure out if it is of sufficient
quality; only when that is the case will DrKonqi allow filing a report in Bugzilla.
Transmission
With all the trace data assembled, we just need to send them off to Bugzilla or Sentry, depending on what the user chose to do.
Bugzilla
The Bugzilla case is simply sending a very long string of the backtrace to the Bugzilla API (albeit surrounded by some JSON).
Sentry
The Sentry case on the other hand requires more finesse. For starters, the Sentry code also works when offline. The trace and optional user message get converted into a Sentry envelope tagged with a receiver address — a Sentry-specific URL for ingestion so it knows under which project to file the crash. The envelope is then written to ~/.cache/drkonqi/sentry-envelopes/. At this point, DrKonqi’s job is done; The actual transmission happens in an auxiliary service.
Writing an envelope to disk triggers drkonqi-sentry-postman.service which will attempt to send all pending envelopes to Sentry using the URL inside the payload. It will try to do so every once in a while in case there are pending envelopes as well, thereby making sure crashes that were collected while offline still make it to Sentry eventually. Once sent successfully, the envelopes are archived in ~/.cache/drkonqi/sentry-sent-envelopes/.
This concludes DrKonqi’s activity. There’s much more detail going on behind the scenes but it’s largely inconsequential to the overall flow. Next time we will look at the final piece in the puzzle — Sentry itself.